Dashboard¶
Part of the user manual. Related: VISIBILITY · PROJECTS · WORKFLOWS · EDMS · NOTIFICATIONS · FRA · SCHEDULER · PERMISSIONS · PEOPLE · CONTACTS · ACTIONS.
The dashboard is REBIM's root view at /. It has two modes:
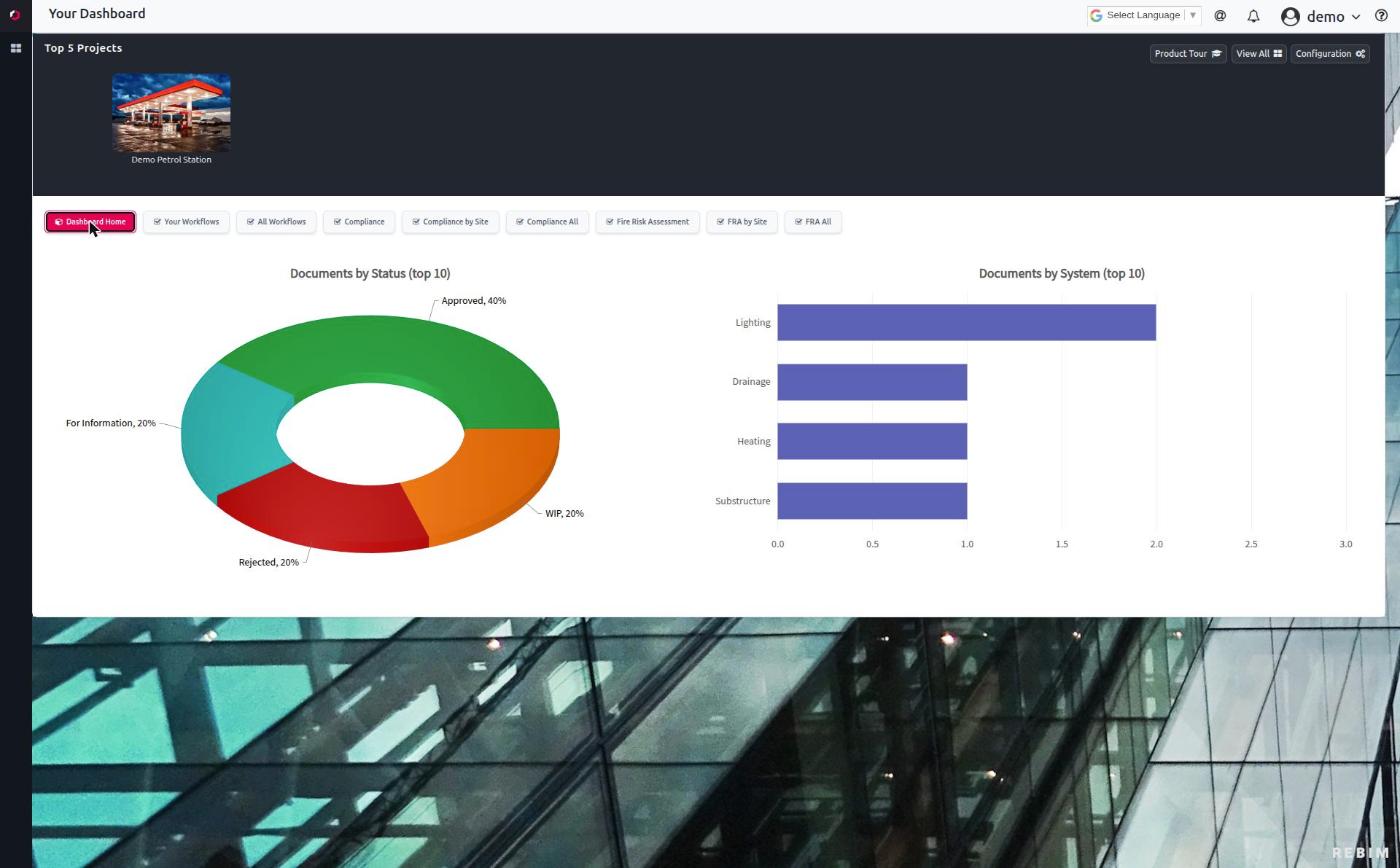
- Cross-project mode (no project selected) — overview reports spanning every project the user can see: Your Workflows, All Workflows, Compliance dashboard, FRA dashboard.
- Project mode (a project selected) — the per-project tabs: Documents, Workflows, Transmittals, People, Contacts, Scheduler, Compliance.
This page is a navigation map. It tells you what's on the dashboard, what each surface shows, and which deeper doc owns each topic.
TL;DR¶
- The dashboard's left sidebar holds the project list + the per-project navigation links.
- The top header carries the notification + mention badges, the product tour launcher, and the user menu.
- The main body switches between cross-project reports (button bar) and per-project tabs depending on whether a project is selected.
- Three user-profile flags control which dashboards are visible:
show_fra,show_compliance,show_all_dashboards. See Dashboard visibility flags below.
The two modes¶
Cross-project mode¶
Visible before a project is selected (or after deselecting). The main body shows a button bar of report views:
| Button | What it shows | Where to dig deeper |
|---|---|---|
| Dashboard Home | The project list (cards with project name, type, status, key counts). The default landing view. | PROJECTS |
| Your Workflows | A per-project rollup of workflows assigned to you (complete / incomplete / overdue / etc.). Backed by the cross-project aggregations_by_project endpoint (one request returns counts for every accessible project + a role_map for client-side role-split). |
WORKFLOWS |
| All Workflows | The full flat workflow events table across every project the user can see. BYOP-chunked. | WORKFLOWS |
| {{ second_edms_tab }} Compliance (3 sub-views) | The Compliance dashboard — three views: overview charts, by-site table, full events table. Filtered to is_compliance=True documents. Tab name configurable via SECOND_EDMS_TAB (default "Compliance"; some installs rename to "Capital Works"). |
EDMS (compliance flag), this page (the dashboard surface) |
| Fire Risk Assessment (3 sub-views) | The FRA dashboard — three views: overview, by-site, full events. Filtered to workflows with is_fra=True. |
FRA |
Visibility of each button is gated by user profile flags (see Dashboard visibility flags below).
Project mode¶
Selecting a project from the sidebar opens the project context. The main body switches to the per-project tab bar:
| Tab | What it shows | Where to dig deeper |
|---|---|---|
| Documents & Files | The project's EDMS document table (the main tab). | EDMS |
| {{ second_edms_tab }} (e.g. Compliance) | A sub-tab — same DataTable, filtered to is_compliance=True docs. |
EDMS § Compliance documents |
| Events & Workflow | The project's workflow events table. | WORKFLOWS |
| Scheduler | Scheduled events that fire workflow events on a recurring schedule. | SCHEDULER |
| Transmittals | The project's transmittals table. | TRANSMITTALS, ACTIONS § Workflow Transmittals kebab |
| People | Project membership — who's on this project, their roles + flags. | PEOPLE, ROLES |
| Contacts | The directory contact list filtered to this project's context. | CONTACTS |
Project mode is exited by clicking the project deselect / "Back to Dashboard" affordance in the sidebar.
Persistent surfaces (visible in both modes)¶
These don't change when switching modes — they live in the chrome around the main body.
Activity panel (#activityPanel)¶
Left sidebar. General notifications feed. See NOTIFICATIONS § Activity panel.
Mention panel (#mentionPanel)¶
Right sidebar. @-mention notifications. See NOTIFICATIONS § Mention panel.
Header¶
Top of page. Carries:
- Notification + mention count badges — unread counts for each panel. See NOTIFICATIONS § Header badges.
- Product Tour launcher (graduation-cap icon button) — opens the Shepherd-based tour. See Product tour below.
- User menu — profile, logout, etc.
- Search-all box (on each table — moves with the active tab).
Dashboard visibility flags¶
Three flags on UserProfile control which cross-project dashboards
the user sees:
| Flag | Default | Effect |
|---|---|---|
show_compliance |
False | When True, the Compliance dashboard buttons appear (Compliance overview / by-site / All). |
show_fra |
False | When True, the FRA dashboard buttons appear (FRA overview / by-site / All). |
show_all_dashboards |
False | When True, overrides the two above: every cross-project dashboard is shown, including "All Workflows" (which is otherwise sometimes gated). |
Defaults are False — a fresh user sees only Dashboard Home + Your Workflows. Compliance + FRA dashboards are opt-in per user.
To toggle: Django admin → Users → (pick user) → User Profile → tick the relevant flag.
These are UI-level toggles, not security boundaries. A user
without show_fra can still see FRA workflow events in their normal
workflow table (subject to role visibility); they just don't get the
cross-project FRA dashboard.
Theme (appearance)¶
Every install has one default theme set in settings.py /
settings_override.py (FRONTEND_THEME) — Classic (the default
theme) unless an install opts into another, e.g. Modern. This default
governs the whole product, including the logged-out pages (login,
password reset), which always use it.
Optional per-user choice at login. The global preference
Allow theme selection on login (misc__allow_theme_select_on_login,
default OFF) adds a small theme radio group to the login screen. When
it's on:
- The radio lists the themes in
settings.AVAILABLE_THEMESand starts on the install default (a cookie remembers the last pick for next time). - The theme chosen at login is applied to that logged-in session only — it is not stored on the account, so it doesn't follow the user to another browser/device, and deleting a theme leaves nothing to clean up.
- The logged-out pages are unaffected — they always show the install default.
When the preference is off (the default), no selector appears and everyone gets the install default — exactly as before.
Adding / removing a theme (admin/deploy task): a theme is a CSS reskin
layered over the standard markup. Add an entry to settings.AVAILABLE_THEMES
((key, label)) and ship core/static/core/css/<key>.css; the default
key is the classic baseline and has no CSS. To remove one, delete its
entry and its CSS file — existing session picks for it fall back to the
install default automatically.
How project selection works¶
The project list (Dashboard Home / left sidebar) shows every project the user can see — filtered per VISIBILITY § layer 2 (membership + ownership + superuser).
Clicking a project:
- Sets the current project context (stored in
apps_dashboard_callback.active_project_idx). - Hides cross-project surfaces; shows per-project tabs.
- Triggers loads for the active project's documents, workflows, etc.
Deselecting / "Back" returns to cross-project mode.
There's no multi-project context — only one project active at a time. The active project gates which per-project tabs show their data; cross-project views always span all visible projects.
Product tour¶
The Shepherd-based product tour
(templates/default/dashboard/dashboard_tour.html) is the
onboarding surface for first-time users. It's a series of
attached-to-element step bubbles that walks through the dashboard's
core surfaces.
Triggers¶
- Auto-start on login if
UserProfile.tour=True(default True for new users). The tour fires once + sets a session flag to prevent immediate re-firing. - Manual launch via the graduation-cap (🎓) icon in the header.
Also visible on the EDMS Documents tab — the only per-tab tour
currently active. (Other tour scopes are defined but their
buttons are commented out in their respective templates — see
devdocs/for the historical context.)
Disabling auto-start¶
User edits their own profile → untick "Automatically start the
Product Tour" → save. (Or admin → Users → User Profile → uncheck
tour.)
Tour content¶
Four tours are defined in dashboard_tour.html:
dashboardTour— main onboarding (welcome + nav overview).projectsTour— project list deep dive.edmsTour— EDMS Documents tab walkthrough.workflowTour— workflows tour (defined but button commented out).
The tour content is separate from this manual. See README § Relationship to the in-app product tour for the rationale + deferred "tour-from-MD" refactor.
Refresh / load behaviour¶
The dashboard's data loads are lazy + cached in the frontend:
- Notifications + mentions load on dashboard init. Refreshable via the panel's refresh affordance.
- Project list loads on dashboard init.
- Cross-project reports (Your Workflows / All Workflows /
Compliance / FRA) load on first click; cached thereafter until a
manual Refresh button is clicked OR the user navigates away + back.
Flags like
done_compliance_graphstrack which have loaded. - Per-project tabs load on tab activation; cached per project.
The cached behaviour is why a recently-changed workflow event might not immediately appear — the user may need to click Refresh, or switch tabs and back, depending on which surface they're on.
The notification panels have their own awareness labels for truncation — see NOTIFICATIONS § Awareness labels.
Practical operations¶
Switch to a project¶
Click the project in the sidebar list. Tabs at the top of the main body switch to the per-project set.
Switch between cross-project reports¶
Click the report buttons in the button bar (visible when no project is selected): Dashboard Home / Your Workflows / All Workflows / Compliance views / FRA views.
Refresh a stale dashboard¶
Each cross-project report has a Refresh button. Click it to re-fetch + re-render.
See which dashboards a user has access to¶
Admin → Users → (user) → User Profile → check the three show_*
flags. The dashboard renders buttons conditional on these.
Pin a project to the top of the sidebar¶
Edit the project → tick pinned → save. See PROJECTS § Project
attributes.
Launch the product tour¶
Click the graduation-cap icon in the header. The tour starts at step 1. Closeable at any time via the X icon in the tour bubble.
Troubleshooting¶
| Symptom | Likely cause | First check |
|---|---|---|
| Project list is empty | No projects visible to this user. Tenancy + membership filters apply | VISIBILITY — walk the layers |
| Compliance dashboard buttons missing | UserProfile.show_compliance=False (the default) |
Toggle the flag in admin |
| FRA dashboard buttons missing | UserProfile.show_fra=False |
Toggle the flag in admin |
| User says "All Workflows" button missing | Visibility depends on install + show_all_dashboards. Some installs gate it specifically |
Check UserProfile.show_all_dashboards + the relevant install template overrides |
| Project list shows fewer projects than I expect | Tenancy + membership filter (see VISIBILITY). A user can be in the tenancy but not on the projects | VISIBILITY § layer 2 |
| Recently created workflow event doesn't appear in Your Workflows | Cached cross-project report data. Click Refresh on Your Workflows | Refresh button |
| Notification badge shows unread count but the panel is empty | Frontend desync between badge state + panel render. Force a refresh of the activity panel | Hit the refresh affordance OR reload the page |
| Tab doesn't appear on a project I have access to | Tab visibility may be gated by group permissions on the underlying model (e.g. Schedule tab needs SCHEDULE VIEW). See PERMISSIONS | Group memberships |
| Product Tour starts every login despite "don't auto-start" being checked | UserProfile.tour flag should be False — the checkbox writes to it. If still firing, the checkbox state isn't persisting |
Profile → tour flag |
| Project I just unpinned re-appears at the top | pinned field cached client-side; reload |
Hard refresh |
| Compliance dashboard shows different numbers each session | The cron's compliance_report pass writes monthly EdmsComplianceReport rows. Mid-month counts can shift as docs change status. See SCHEDULER § What ELSE the cron does |
Cron run timing |
For developers¶
This page is for users and admins. Implementation pointers:
- Main view:
apps/dashboard/views.py: index— renderstemplates/default/dashboard/dashboard.html. - Bootup script:
templates/default/dashboard/dashboard_bootup.html— setsfrontend_app_core.*globals consumed by the JS modules. - JS:
apps/dashboard/static/dashboard/js/app_dashboard.js(the main dashboard controller) +app_explorer.js(the explorer view). - Project list + cross-project switching: the JS module's
goto_*methods (goto_documents,goto_events,goto_compliance,goto_people, etc.) handle tab switching. - Cross-project tables:
dtWfAll(All Workflows),dtClAll(Compliance by Site),dtClEdmsAll(Compliance All — BYOP-wired),dtFraAll(FRA by Site). - User profile flags: read server-side in
dashboard/views.pycontext; the template conditionally renders buttons. JS doesn't re-check. - Product tour:
templates/default/dashboard/dashboard_tour.html— Shepherd.js definitions. Auto-fire on init ifuserprofile.tour=True. See README § Relationship to the in-app product tour for the strategic positioning. - Refresh behaviour: the various
done_*flags (done_compliance_graphs,done_detailed_report, etc.) gate expensive re-fetches. Refresh buttons clear these + re-run.
See devdocs/ for codebase-level material.